Business Intelligence & Data Analytics

Turn scattered data into reliable insights: consolidated pipelines, one source of truth and dashboards that enable faster, evidence-driven decisions.

svg shape
About image
info Why BI & Data Analytics

Make decisions faster with a single source of truth

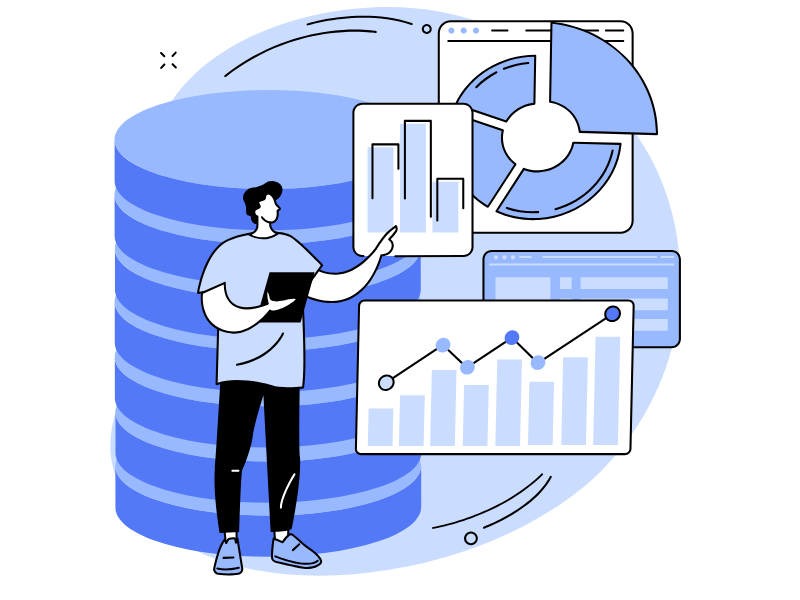
We build robust data foundations so teams can trust the numbers. Our approach unifies sources, validates data quality and converts raw feeds into KPIs your business can act on — not just dashboards, but decision-grade information.

Through pragmatic ETL/ELT, semantic modeling and iterative dashboard design, we deliver measurable outcomes: fewer manual reports, faster decision cycles and clearer accountability across functions.

campaign Did You Know?

  • insights Many organisations have 2–3 conflicting metrics for the same KPI; a semantic layer solves that.
  • trending_up A focused 2-week diagnostic often reveals 3–5 high-impact data fixes that improve reporting reliability immediately.
Request a 2-week data diagnostic
What we deliver fast

Practical analytics use cases that create measurable value

  • Data Consolidation & ETL/ELT
    Centralize ERP, CRM and log data into repeatable pipelines with automated quality checks.
  • KPI Modeling & Semantic Layer
    Define one source of truth for core metrics so every report uses the same business logic.
  • Operational Dashboards
    Real-time tactical dashboards tailored to operations, support and sales with alerts and SLA tracking.
  • Advanced Analytics & Forecasting
    Time-series forecasts, cohort analysis and scenario models that improve planning and procurement.
  • Self-Service Analytics
    Empower teams with governed data access and curated datasets for ad-hoc exploration without IT bottlenecks.
  • Data Quality & Lineage
    Automated tests, lineage tracking and alerting so you know when and why numbers change.

Start a 2-week data diagnostic — find the top 3 impact fixes
image
Our BI Delivery Process

From dirty data to decision-ready dashboards — a measured approach

icon

Discovery & KPI Alignment

Run stakeholder workshops to map decisions and define the KPIs that matter. Output: prioritized metric list, data sources map and acceptance criteria.

01
icon

Pipeline & Model Design

Design ETL/ELT pipelines, data model (dimensional or lakehouse) and semantic layer. Implement data quality checks and lineage for traceability.

02
icon

Dashboard Build & Validation

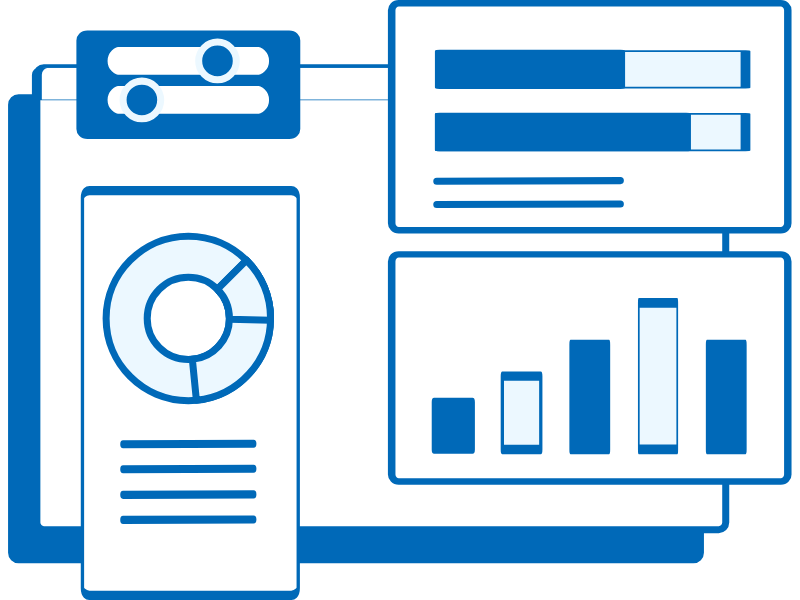
Iterative dashboard development with users — deliver operational and strategic views, alerts and drill-downs. Validate numbers against source systems.

03
icon

Governance, Adoption & Scale

Define data catalog, SLAs and training. Monitor usage, refine metrics and roll out self-service capabilities with guardrails.

04
Our Solutions & Technologies

What We Offer

AI & Automation

Intelligent process automation for enhanced efficiency.

Digital Transformation

Empower your business with cutting-edge digital solutions

Custom Software Development

Develop tailored apps that integrate seamlessly with your business.

Cybersecurity & Risk Management

Protect your assets with top-tier security measures.

Cloud & IT Management

Scalable and secure cloud-based solutions.

Data Analytics & Business Intelligence

Transform raw data into actionable insights.

Contact Us

Get decision-ready data — start with a short diagnostic

Submit a request for a 2-week data diagnostic — we’ll map your sources, validate key metrics and deliver a prioritized list of changes with estimated effort and impact.